Understanding inbox placement 2026 trends is critical for anyone managing email deliverability. Your dashboard says 98% delivered. You close the laptop satisfied. Meanwhile, one in six of your emails is sitting in a spam folder that nobody checks — and your ESP isn’t going to tell you that.
This is the core deliverability lie of 2026: the number your platform shows you measures whether a receiving server accepted your message. It says nothing about where that message actually landed. The gap between those two things is where revenue quietly disappears.
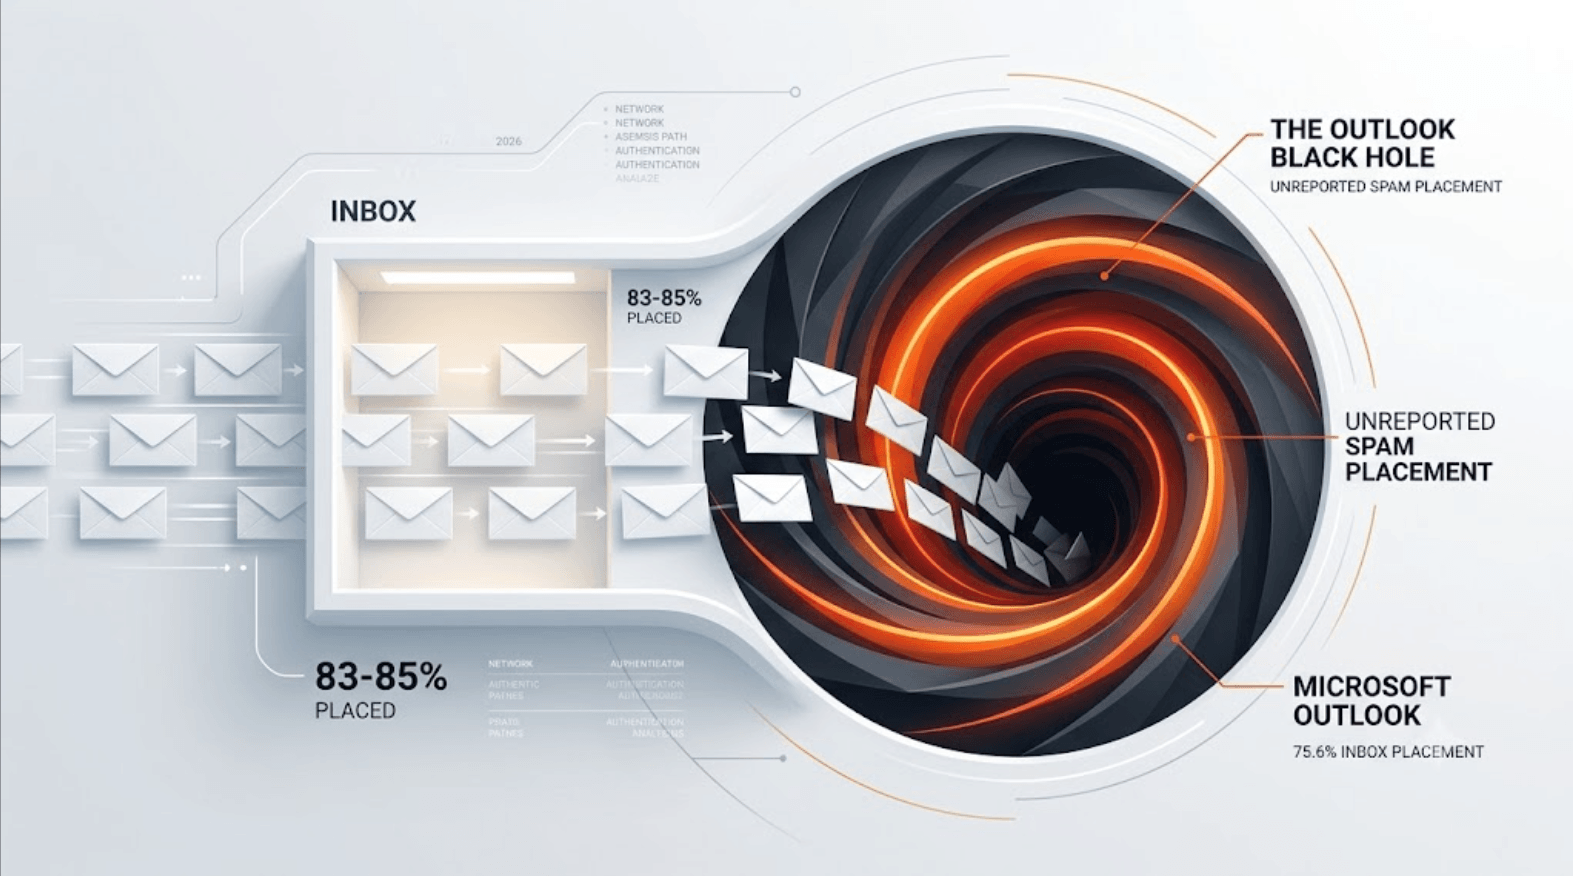
The global average inbox placement rate — the percentage of sent emails that actually reach a visible inbox — sits at 83–85% in 2026. That means on a list of 100,000 subscribers, roughly 15,000 to 17,000 emails vanish into spam folders every single send, completely invisible to the recipient and completely unreported by your ESP dashboard.
That’s not a rounding error. That’s a structural revenue leak.
The Outlook Black Hole
Not all inbox placement problems are created equal. The numbers vary significantly by mailbox provider — and one of them is dramatically worse than the rest.
Global Inbox Placement Rate (2026)
The Outlook Black Hole comparison
Outlook is the black hole. At 75.6% inbox placement, nearly one in four emails sent to Outlook recipients never reaches the inbox. They don’t bounce. They don’t generate an error. They simply disappear into a spam or junk folder with no signal back to the sender.
Why Outlook specifically?
Microsoft’s filtering stack — SmartScreen and Exchange Online Protection — uses continuously updated machine learning models that weight sending domain age, IP reputation, authentication completeness, engagement signals, and complaint rates simultaneously. It is one of the most aggressive commercial inbox filters in operation.
The practical consequence is significant for both B2B and B2C senders:
For B2B: Outlook and Microsoft 365 dominate corporate email infrastructure. If your lead nurture sequences, sales follow-ups, or onboarding emails are targeting business addresses — a meaningful portion of your list is almost certainly Outlook-hosted. A 24.4% spam rate on that segment is not an edge case. It’s your pipeline silently leaking.
For B2C: Outlook.com has tens of millions of active consumer accounts globally. A weak Outlook score drags down your overall inbox placement even when your Gmail performance looks healthy — because your dashboard aggregates everything into one number that hides provider-level reality.
he Reality of Inbox Placement 2026 and Authentication Standards
Here is where 2026 breaks with everything that came before it.
The three dominant mailbox providers — Google, Yahoo, and Microsoft — have all crossed the same threshold this year: they no longer delay or route to junk unauthenticated bulk mail. They reject it outright.
Non-compliant mail now receives a hard rejection at the SMTP level:
meet the required authentication level.
Critically, this check happens before personal allow lists are consulted. A recipient adding you to their Safe Senders list does not override it. The era of relying on individual recipients to rescue your deliverability is finished.
The myth that needs to die: authentication as a guarantee
Most marketers still treat SPF, DKIM, and DMARC as a deliverability solution. They are not. They are the entry ticket.
The data from 2025-2026 corpus analysis makes this uncomfortable to read: fully authenticated mail — valid SPF, DKIM, and DMARC — still experiences spam placement rates above 30% when engagement signals are poor. You can pass every authentication check and still land in spam.
Once authentication confirms you are who you claim to be, mailbox providers shift to a completely different question: Do the people you mail actually want it?
They answer that question using engagement signals:
- Opens, clicks, replies, and time spent reading → positive signals
- Delete-without-reading, fast scrolling past, moving to spam → negative signals
- Complaint rate crossing 0.10% on Gmail → immediate suppression risk
The complaint threshold is now a hard operational limit. For a sender pushing 5,000 emails per day — the threshold where Gmail’s bulk sender requirements kick in — a single spam complaint per day puts you at 0.10%, right at the line. Two complaints and you’re over it.
Authentication gets you to the starting line. Engagement signals decide whether you finish the race.
How to Track What Your ESP Won’t Tell You
Stopping at your ESP’s delivery rate dashboard in 2026 is the equivalent of checking whether your package left the warehouse and calling it delivered. Here are three operational changes that give you actual visibility.
1. Run inbox placement tests with a seed list tool
Tools like GlockApps, Litmus Spam Testing, or Mail-Tester send your campaign to a set of seeded addresses across Gmail, Outlook, Yahoo, and Apple Mail simultaneously. They report exactly where each variant landed — primary inbox, promotions tab, spam, or missing entirely.
Run placement tests before every major campaign, not after. By the time you see low click rates in your dashboard, the damage is done. A pre-send test takes 15 minutes and tells you what your ESP cannot.
2. Segment your list by engagement before you send — not after
Sending to a full list regardless of engagement history is the fastest way to accumulate the negative signals that degrade inbox placement over time. The practical approach:
- Active segment: opened or clicked in the last 90 days → send normally
- Warm segment: 90–180 days of inactivity → send with a re-engagement sequence, not the full campaign
- Cold segment: 180+ days of no engagement → suppress until a dedicated win-back sequence is run
Mailing the cold segment alongside your actives inflates your apparent send volume while dragging down your engagement rate — and mailbox providers read that pattern accurately as low-quality sending.
3. Monitor complaint rates by provider, not just in aggregate
Most ESPs show you an aggregate complaint rate. That number hides provider-level problems. A 0.08% overall rate might look safe — until you realize your Outlook-specific complaint rate is 0.19% because a segment of your list is heavily Microsoft-hosted.
Use Google Postmaster Tools for Gmail-specific complaint data. For Outlook, Microsoft’s SNDS (Smart Network Data Services) provides domain and IP reputation signals that your ESP dashboard never surfaces. Check both weekly, not monthly.
Verdict
Your ESP’s 98% delivery rate is a confidence metric for the platform, not a performance metric for your business. It tells you your emails left the building. It tells you nothing about whether anyone will ever see them.
The real number to track is inbox placement by provider. And right now, that number for Outlook is 75.6% — a figure that makes it the single biggest quiet threat in most email programs, B2B or B2C.
Authentication is no longer a differentiator. It’s a minimum requirement, and passing it only means your emails get evaluated instead of rejected outright. From that point forward, engagement signals make every decision that matters.
The marketers who understand this distinction — and build their programs around earning engagement rather than just clearing authentication gates — will occupy the inboxes that everyone else is silently losing.
Conclusion
Understanding inbox placement 2026 trends is critical for anyone managing email deliverability. For deeper insights on email security, check out my other guide on email authentication standards. Mastering these requirements is not just a technical necessity but a revenue-saving strategy for any brand.
Sources
- Digital Applied: Email Deliverability 2026 — The Inbox-Placement Playbook, June 5, 2026 — digitalapplied.com/blog/marketing-email-deliverability-2026-inbox-placement-playbook
- Digital Applied: Email Deliverability Benchmarks 2026 by Industry — digitalapplied.com/blog/email-deliverability-benchmarks-2026-industry
- Unspam.email: 2025 Email Deliverability Report — unspam.email/articles/email-deliverability-report/
- Validity 2025 Benchmark Report (global inbox placement 83.5%) — validity.com
- Scaled Mail: Email Deliverability News, Gmail/Yahoo/Microsoft Changes — scaledmail.com/blogs/email-deliverability-news